


第1回はSVGの基礎知識を、
HTMLなページへのSVGの埋め込みテクニック
第1回で解説しましたが、
まずはシンプルにresponseXMLを使う方法です。この方法はFirefox, Opera, Safari, Chromeなどで動作します。残念ながらIE9 Platform Preview 3
var xhr = new XMLHttpRequest();
xhr.open('GET', 'blue-star.svg', true);
xhr.onload = function(){
  var stage = document.getElementById('svg-sample-1');
  var svgroot = xhr.responseXML.documentElement;
  if (svgroot){
    var svg = stage.appendChild(document.adoptNode(svgroot));
  }
};
xhr.send();
responseXMLの代わりにDOMParserを利用する方法もあります。DOMParserが文字列をDOMに変換する処理を担います。XMLHttpRequest以外をソースにすることもできますし、
var xhr = new XMLHttpRequest();
xhr.open('GET', 'blue-star.svg', true);
xhr.onload = function(){
  var svgtext = xhr.responseText;
  var svgdom = new DOMParser().parseFromString(svgtext,'application/xhtml+xml');
  var stage = document.getElementById('svg-sample-2');
  var svg = stage.appendChild(document.adoptNode(svgdom.documentElement));
};
xhr.send();
これ以外に、
現時点では、
if (svgroot) {
svg = stage.appendChild(document.adoptNode(svgroot));
} else {
stage.innerHTML = xhr.responseText.replace(/^\s*<\?xml[\s\S]*?\?>/i, '').replace(/^\s*<\!DOCTYPE[\s\S]*?>/i,'');
svg = stage.querySelector('svg');
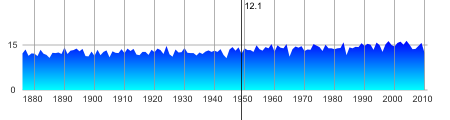
}グラフの作成
この連載のまとめとして、
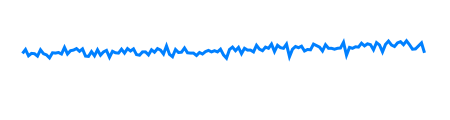
まずはシンプルにpolylineを使って描いてみます。
var temperature = [
12.2,13.5,11.4,12.2,12.1,11.3,13.4,12.1,11.7,10.7,12.4,12.3,12.5,12.0,14.2,12.0,13.1,13.3,13.8,12.9,13.7,11.3,11.2,12.8,11.4,13.4,11.6,12.7,
13.2,10.9,12.9,12.4,12.3,13.6,12.3,13.8,13.0,13.7,11.8,11.6,12.7,12.7,11.7,13.4,12.6,13.8,13.3,12.0,14.7,11.9,11.1,13.5,12.5,12.6,14.0,12.4,
12.3,12.3,11.5,12.5,12.0,12.8,13.2,12.7,13.1,12.7,13.6,11.7,10.6,13.5,14.3,13.1,14.2,12.1,13.9,13.3,13.3,12.7,14.9,13.6,13.1,14.3,13.9,15.3,
12.8,14.9,14.1,13.9,15.3,11.1,13.6,14.5,14.1,14.6,13.0,13.5,13.4,15.3,14.8,14.3,13.0,15.1,13.9,13.9,13.6,13.9,14.0,15.9,11.6,14.2,13.9,14.4,
14.3,15.6,14.7,15.4,15.1,13.4,15.8,15.0,12.7,15.2,16.3,15.0,14.5,15.7,16.1,15.1,16.4,15.1,13.6,13.7,14.7,15.7,12.4
];var svg = document.createElementNS(SVG,'svg');
svg.setAttribute('viewBox', '0 0 150 40');
var polyline = document.createElementNS(SVG,'polyline');
var line = temperature.map(function(v, i){return i+','+v;}).join(' ');
polyline.setAttribute('points', line);
polyline.setAttribute('fill', 'none');
polyline.setAttribute('stroke', '#0080FF');
svg.appendChild(polyline);
root.appendChild(svg);ここでのポイントはviewBoxで1つの値を何ピクセル相当にするか調整している点です。グラフの表示エリアを幅450px、
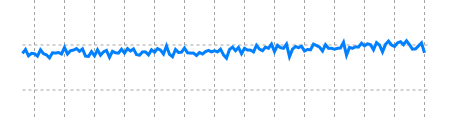
このままでは情報が少ないので補助線などを追加してみます。
// 0度の線
var zero_line = document.createElementNS(SVG,'line');
zero_line.setAttribute('stroke-dasharray', 1);
zero_line.setAttribute('x1', '0');
zero_line.setAttribute('y1', '30');
zero_line.setAttribute('x2', '135');
zero_line.setAttribute('y2', '30');
zero_line.setAttribute("stroke", "#999");
zero_line.setAttribute("stroke-width", "0.3");
g.appendChild(zero_line);

// 15度の線
var half_line = document.createElementNS(SVG,'line');
half_line.setAttribute('stroke-dasharray', 1);
half_line.setAttribute('x1', '0');
half_line.setAttribute('y1', '15');
half_line.setAttribute('x2', '135');
half_line.setAttribute('y2', '15');
half_line.setAttribute("stroke", "#999");
half_line.setAttribute("stroke-width", "0.3");
g.appendChild(half_line);

var start = 1876;
var gvline = document.createElementNS(SVG,'g');
gvline.setAttribute("stroke", "#999");
gvline.setAttribute('stroke-dasharray', 1);
gvline.setAttribute("stroke-width", "0.3");
g.appendChild(gvline);
for (var i = 0, len = temperature.length;i < len;i++){
  if ((i+start)%10 === 0){
    // 10年置きに縦に線を引く
    var vline = document.createElementNS(SVG,'line');
    vline.setAttribute('x1', i);
    vline.setAttribute('y1', 0);
    vline.setAttribute('x2', i);
    vline.setAttribute('y2', 40);
    gvline.appendChild(vline);
  }
}
// クリックしたときにズーム
var zoom = false;
root.onclick = function(e){
  if (zoom){
    root.style.position = 'static';
    root.style.width  = '450px';
    root.style.height = '120px';
  } else {
    root.style.position = 'fixed';
    root.style.top = '5%';
    root.style.left = '5%';
    root.style.width  = document.documentElement.clientWidth*0.9 +'px';
    root.style.height = document.documentElement.clientHeight*0.9+'px';
  }
  zoom = !zoom;
};
グラフの領域をクリックしたときにSVGの親要素のサイズを画面に合わせて拡大するようにしました。svg要素はデフォルトで親要素いっぱいに表示を広げるため、
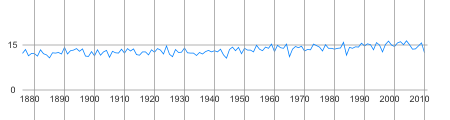
さらに、
// 0度のラベル
var zero_label = document.createElementNS(SVG,'text');
zero_label.setAttribute('x', -4*zoom);
zero_label.setAttribute('y', 31*zoom);
zero_label.textContent = 0;
zero_label.setAttribute("fill", "#333");
g.appendChild(zero_label);

// 15度のラベル
var half_label = document.createElementNS(SVG,'text');
half_label.setAttribute('x', -5*zoom);
half_label.setAttribute('y', 16*zoom);
half_label.textContent = 15;
half_label.setAttribute("fill", "#333");
g.appendChild(half_label);

var start = 1876;
var gyearlabel = document.createElementNS(SVG,'g');
gyearlabel.setAttribute("fill", "#333");
g.appendChild(gyearlabel);
for (var i = 0, len = temperature.length;i < len;i++){
  if ((i+start)%10 === 0){
    // 10年置きにラベルを書く
    var yearlabel = document.createElementNS(SVG,'text');
    yearlabel.setAttribute('x', (i-5)*zoom);
    yearlabel.setAttribute('y', 34*zoom);
    yearlabel.textContent = i+start;
    gyearlabel.appendChild(yearlabel);
  }
}
さらに、
var mouse_vline  = document.createElementNS(SVG,'line');
mouse_vline.setAttribute('x1', 0);
mouse_vline.setAttribute('y1', 0);
mouse_vline.setAttribute('x2', 0);
mouse_vline.setAttribute('y2', 40*zoom);
mouse_vline.setAttribute("stroke", "#000");
mouse_vline.setAttribute("stroke-width", 1);
g.appendChild(mouse_vline);
var mouse_label  = document.createElementNS(SVG,'text');
mouse_label.setAttribute('x', 0);
mouse_label.setAttribute('y', 3*zoom);
g.appendChild(mouse_label);
var isIE = !!window.ActiveXObject;
var left = root.getBoundingClientRect().left;
root.onmousemove = function(e){
  var matrix = bg.getScreenCTM();
  var x;
  if (isIE){
    x = e.clientX - matrix.e - left;
  } else {
    x = e.clientX - matrix.e;
  }
  var _x = Math.round(x / matrix.a / zoom);
  if (_x >= 0 && _x < 135) {
    mouse_vline.setAttribute('x1', _x*zoom);
    mouse_vline.setAttribute('x2', _x*zoom);
    mouse_label.setAttribute('x', (_x+1)*zoom);
    mouse_label.textContent = temperature[_x];
  }
};
ここで、
そこで、
なお、
最後にグラフに簡単なアニメーションを追加してみます。
var timer;
var animation = function(){
  polyline.points.clear();
  var begin = +new Date();
  var index = 0;
  var p1 = svg.createSVGPoint();
  p1.x = 0;
  p1.y = 30*zoom;
  var p2 = svg.createSVGPoint();
  p2.x = 0;
  p2.y = 30*zoom;
  polyline.points.appendItem(p1);
  polyline.points.appendItem(p2);
  var anime = function(){
    var now = +new Date();
    var progress = Math.floor((now - begin) / 10);
    if (progress >= temperature.length) {
      clearInterval(timer);
      timer = null;
    }
    for(var i = index;i < progress && temperature[i];i++){
      var p1 = polyline.points.getItem(0);
      p1.x = i*zoom;
      var v = temperature[i];
      var p = svg.createSVGPoint();
      p.x = i*zoom;
      p.y = (30-v)*zoom;
      polyline.points.appendItem(p);
    }
    index = progress;
  };
  if (timer) {
    clearInterval(timer);
  }
  timer = setInterval(anime, 1000/60);
};
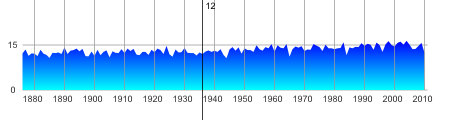
折角なので、
var paper = Raphael(root, 450, 120);
var line = 'M22.5 90';
for(var i = 0;i < temperature.length;i++){
  line += 'L'+(22.5+i*3)+' '+(30-temperature[i])*3;
}
line += 'L425.5 90'
var poly = paper.path(line);
poly.attr({
  'gradient':'270-#ff0000-#ff00ff',
  stroke:'none'
});

var lv = paper.set();
lv.push(
  paper.text(10.5, 90, "0"),
  paper.text(10.5, 45, "15")
);

var st = paper.set();
st.push(
  paper.path("M22.5 90L426.5 90"),
  paper.path("M22.5 45L426.5 45")
);
var start = 1876;
for (var i = 0, len = temperature.length;i < len;i++){
  if ((i+start)%10 === 0){
    st.push(paper.path('M' + (22.5+i*3) + ' 0 L'+(22.5+i*3)+' 90'));
    lv.push(paper.text(22.5+i*3, 102, (i+start)));
  }
}
lv.attr({fill:'#333'});
st.attr({'stroke-dasharray':'-',stroke:'#999'});
var v = paper.path("M22.5 0L22.5 90");
v.attr({stroke:'#0080FF'});

//st.mousemove(function (e) {
root.onmousemove = function(e){
  if(!e) e = window.event;
  var x, mouseX = e.clientX - root.getBoundingClientRect().left;
  if(mouseX < 22.5){
    x = 22.5;
  } else if(mouseX > 426.5){
    x = 425.5;
  } else {
    x = mouseX;
  }
  v.remove();
  v = paper.path('M'+x+' 0L'+x+' 90');
  v.attr({stroke:'#0080FF'});
};
//});まとめ
SVGの基礎知識から具体的な書き方までざっくりと解説してみましたがいかがでしたでしょうか? SVGはスマートフォンや、